> For the complete documentation index, see [llms.txt](https://docs.stakingrewards.com/defi-ratings/llms.txt). Markdown versions of documentation pages are available by appending `.md` to page URLs; this page is available as [Markdown](https://docs.stakingrewards.com/defi-ratings/rating-methodology/scoring-model.md).
# Scoring Model
### Question-Level Scoring
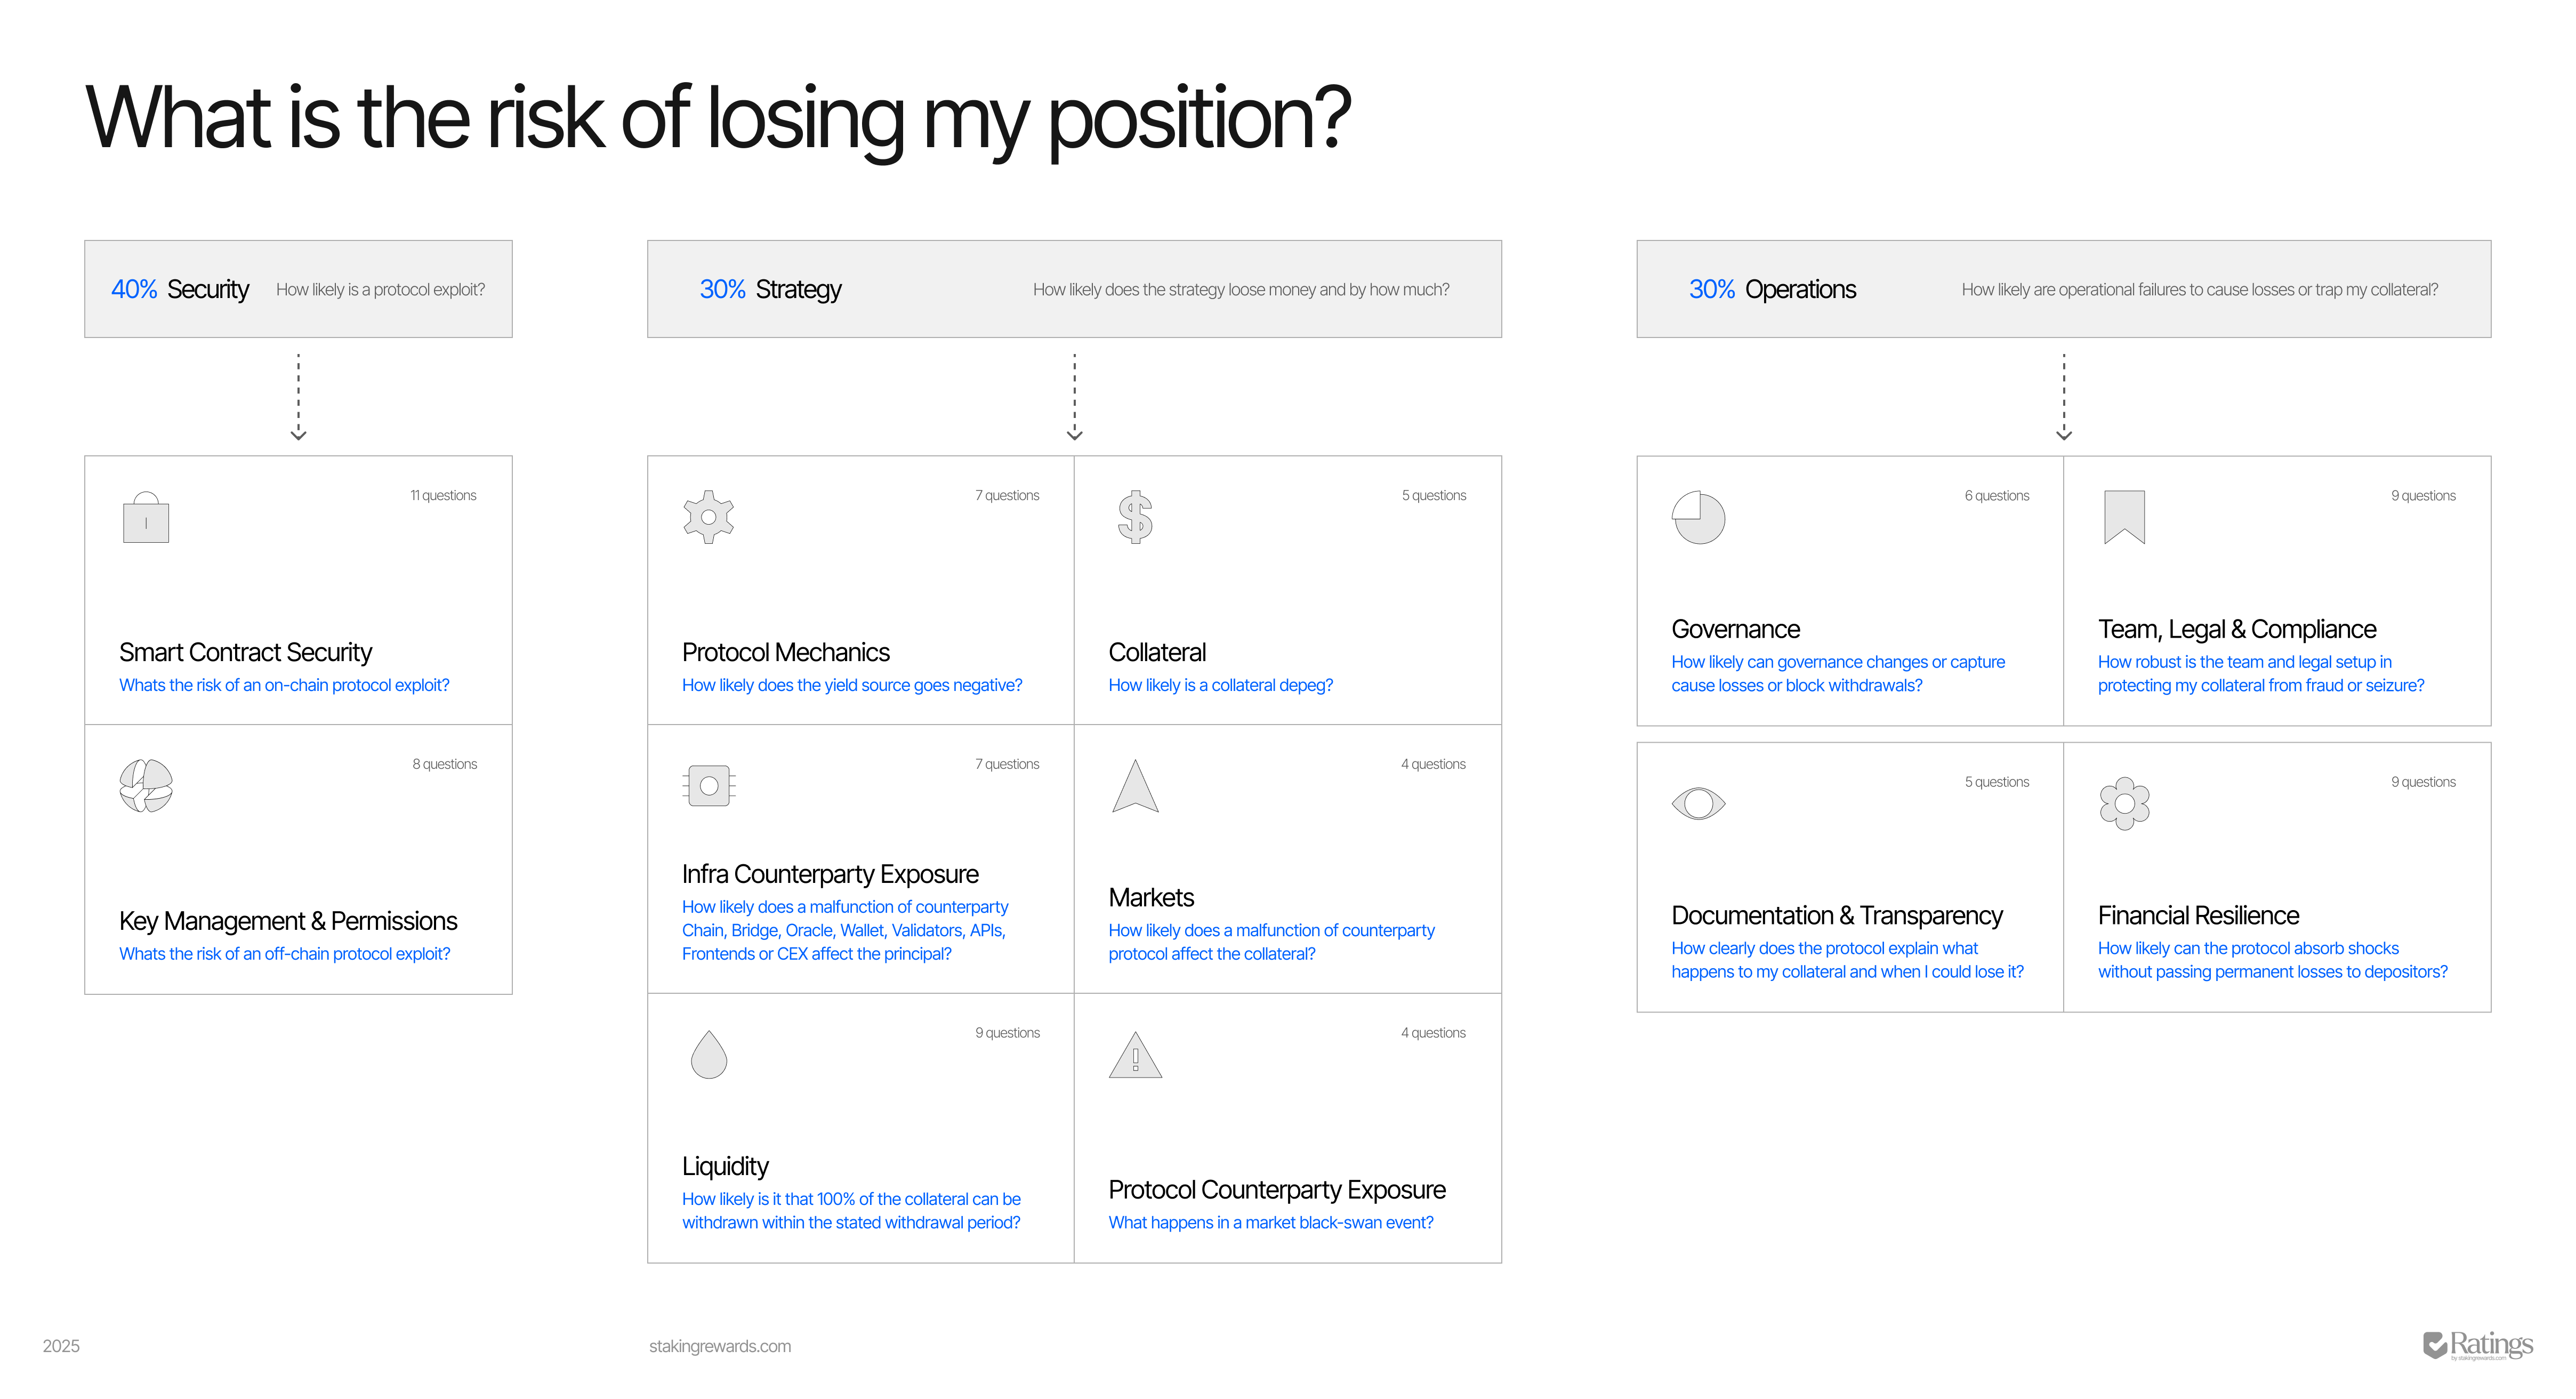
The framework currently consists of **84 questions** distributed across:
* **2 Security sub-categories**
* **6 Strategy sub-categories**
* **4 Operations sub-categories**
Each question is scored into one of three **risk groups**:
* **Lowest risk** → high score (e.g., 9 points)
* **Mid risk** → medium score (e.g,. 3 points)
* **Highest risk** → low score (e.g,. 1 point)
**Missing data is treated as the worst case and counted with 0 points.** \
In DeFi, transparency is a core part of risk: if you do not know, we assume that anything can happen.
### Aggregation
* Within each **sub-category**, question scores are aggregated into a **sub-category score**.
* Sub-categories are **equally weighted** within their pillar.
* Each pillar (Security, Strategy, Operations) contributes its **fixed weight** (40 / 30 / 30) to the total score.
#### Notation
* **Pillars** $$(p \in {\text{Sec}, \text{Strat}, \text{Ops}})$$
* **Pillar weights:** $$(w\_{\text{Sec}} = 0.40), (w\_{\text{Strat}} = 0.30), (w\_{\text{Ops}} = 0.30), with (\sum\_{p} w\_p = 1)$$
* **For each pillar** $$(p)$$:
* $$(N\_p)$$: number of sub-categories in pillar $$(p)$$
* Sub-categories indexed by $$(i = 1, \dots, N\_p)$$
* $$(n\_{p,i})$$: number of questions in sub-category $$(i)$$ of pillar $$(p)$$
* Question scores $$(q\_{p,i,j} \in {1, 3, 9}) for (j = 1, \dots, n\_{p,i})$$
#### Total Points
$$
\text{Points} =
\sum\_{p} w\_p \cdot
\left(
\frac{1}{N\_p}
\sum\_{i=1}^{N\_p}
\frac{1}{n\_{p,i}}
\sum\_{j=1}^{n\_{p,i}} q\_{p,i,j}
\right)
$$
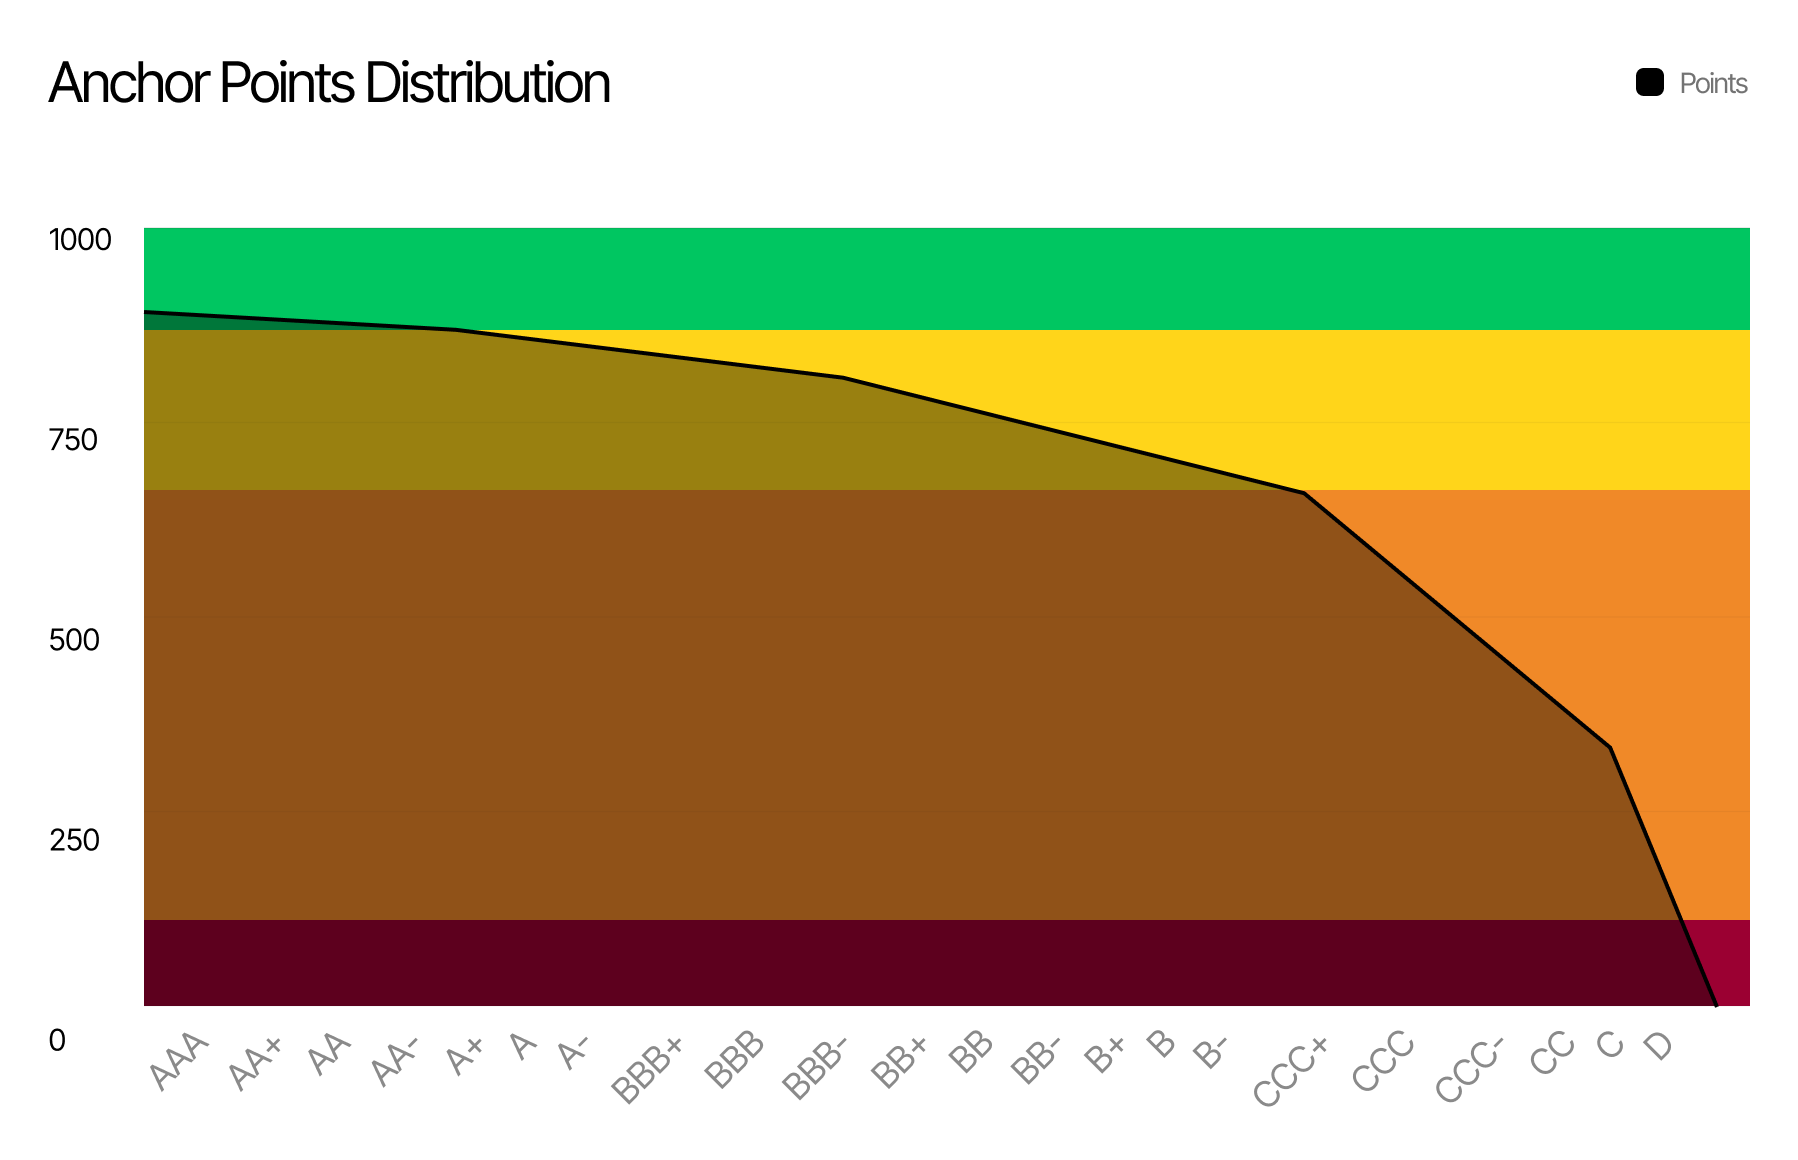
Given the current structure, the **maximum total score** is **900 points**, corresponding to the lowest observable risk and thus an **AAA**-level profile under our scale. Lower scores map into lower rating bands (AA through D).
The exact mapping between numeric score ranges and rating bands is documented and versioned within the methodology and applied consistently across all protocols.